Persian gulf map tracking is the fastest way to see how maritime chokepoints, naval patrol arcs, and insurance risk zones can change conflict exposure within hours. If you are following Strait of Hormuz shipping disruptions, Gulf of Oman route shifts, and regional missile risk indicators, this page connects those signals into one operational geography.
Instead of treating geography as static background, this guide maps where pressure accumulates first and which movement patterns usually precede broader market shocks. The goal is to help analysts, operators, and policy teams update assumptions with map-based evidence instead of headline-driven noise.
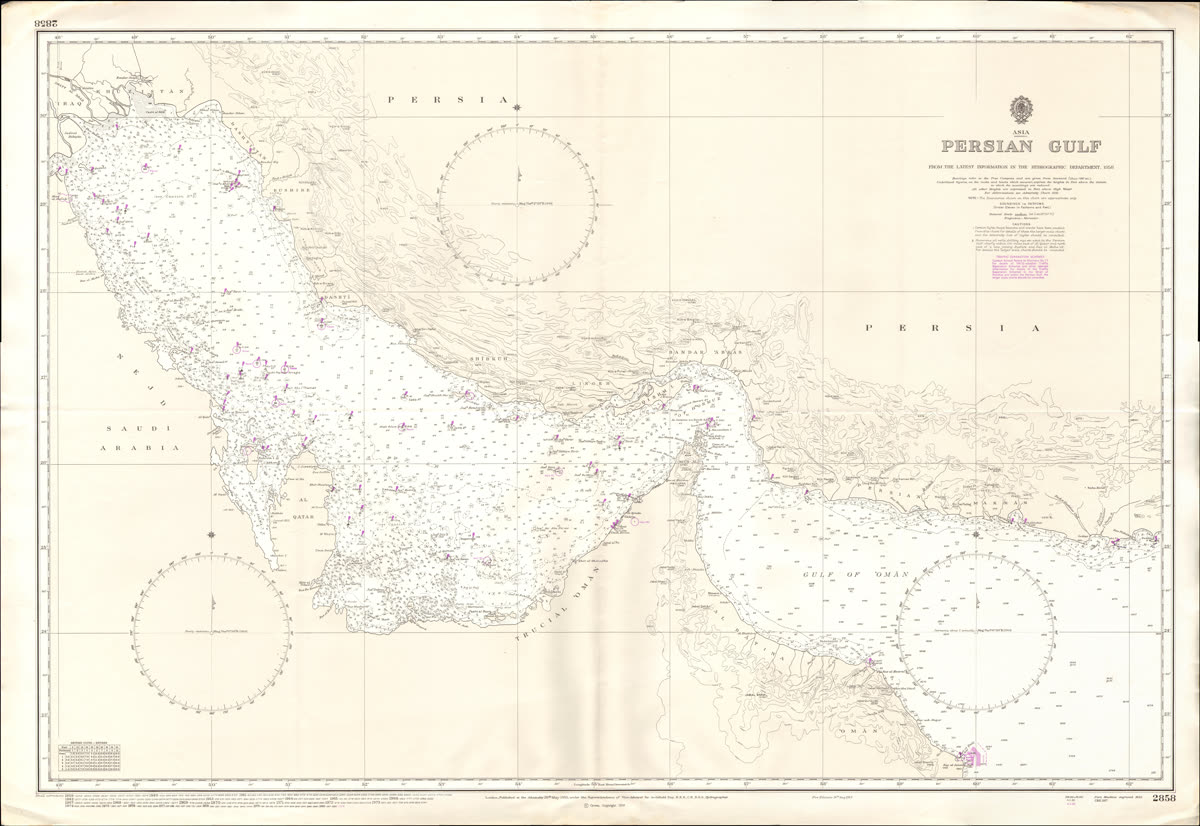
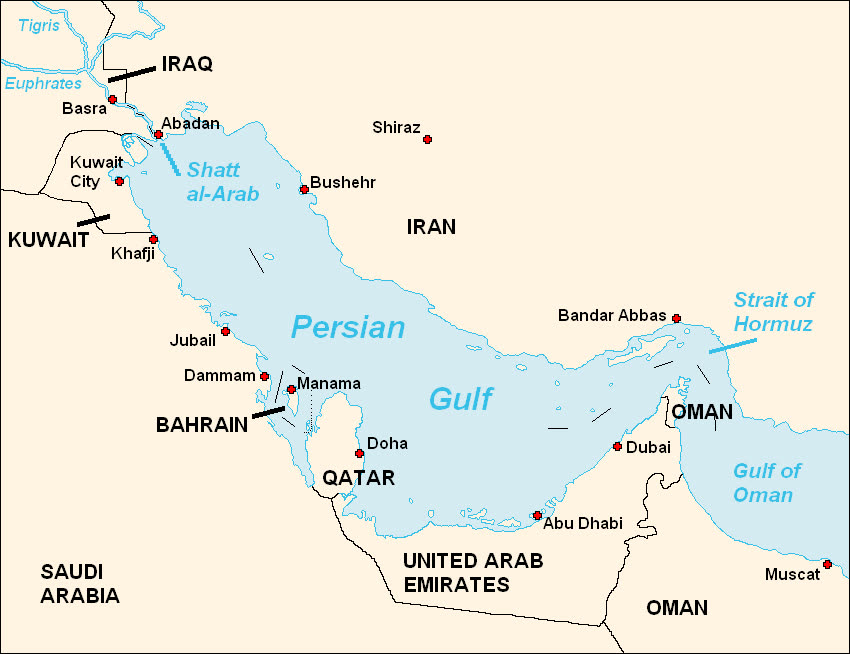
Where Is the Persian Gulf on a Map?
The Persian Gulf sits between Iran's southern coastline and the Arabian Peninsula, but that plain description misses why the map matters. This basin compresses export routes, naval patrols, and energy infrastructure into a relatively narrow operating space. When readers orient themselves correctly, they can see why a local alert near a terminal, island, or patrol arc can echo through shipping decisions far beyond the immediate incident site.
The fastest way to read the geography is to treat this page as the basin-wide layer, then connect it to Gulf of Oman Map Airspace Closures Map Hormuz Strait Map for spillover routing and Strait of Hormuz Shipping Freeze for immediate chokepoint disruption. That keeps the map from becoming a static reference image and turns it into a live operating picture.
| Variable | Current Signal | Risk Implication | Tracking Rule |
|---|---|---|---|
| Map orientation | Rising | Higher near-term uncertainty | Confirm over two windows |
| Coastline adjacency | Mixed | Potentially bounded escalation | Reassess after policy updates |
| Reference baselines | Stable | De-escalation path possible | Track persistence vs narrative shift |
Which Shipping Chokepoints Define Persian Gulf Risk?
The main chokepoint logic is simple: the narrower the commercial lane and the higher the military overlap, the less room operators have to absorb uncertainty. In the Persian Gulf, chokepoint risk is not only about physical width. It is also about how quickly ships can stack up, how easily traffic can be inspected or shadowed, and how difficult it is to reroute around a threatened segment without losing time and confidence.
This is why lane compression often becomes visible before markets fully reprice risk. If advisories, escort chatter, and route spacing all change together, the corridor is already under stress. Readers should connect those signals to Iran Missile Attack Risk Index, because the shipping picture becomes much more dangerous when missile or drone exposure narrows the margin for maneuver.
| Variable | Current Signal | Risk Implication | Tracking Rule |
|---|---|---|---|
| Chokepoint width | Rising | Higher near-term uncertainty | Confirm over two windows |
| Transit density | Mixed | Potentially bounded escalation | Reassess after policy updates |
| Diversion feasibility | Stable | De-escalation path possible | Track persistence vs narrative shift |
How Do Tanker Routes Cluster Near High-Risk Waters?
Tanker routes rarely disperse evenly. Under normal conditions they concentrate around predictable commercial lanes, pilotage patterns, and terminal approaches. Under stress, those clusters can tighten even further as vessels wait for updated guidance, travel in looser informal convoys, or avoid a segment until insurance, naval posture, or traffic-control signals stabilize. The result is that route bunching becomes one of the earliest practical signs that operators are pricing in danger.
The best read is comparative rather than absolute: are ships lingering, spacing farther apart, or shifting their approach timing compared with the previous cycle? When the answer is yes, the Gulf map is no longer just geographic context; it becomes an early-warning indicator for the same disruption narrative covered in Live Iran War Timeline Archive.
| Variable | Current Signal | Risk Implication | Tracking Rule |
|---|---|---|---|
| Outbound lanes | Rising | Higher near-term uncertainty | Confirm over two windows |
| Inbound lanes | Mixed | Potentially bounded escalation | Reassess after policy updates |
| Holding zones | Stable | De-escalation path possible | Track persistence vs narrative shift |
Which Ports Drive Most Export Throughput?
The map matters because export throughput is not evenly spread across every coastline segment. A limited number of ports, offshore terminals, and loading approaches carry a disproportionate share of volume. That concentration means a small number of threatened nodes can distort the entire basin, even if the disruption never becomes a complete closure. A page like this should help readers identify where throughput concentration and route dependency overlap.
The practical question is not only 'which ports are busiest?' but 'which ones are hardest to substitute?' When the answer is 'very hard,' even a narrow disruption can create insurance stress, pricing volatility, and convoy-style behavior. That is why this port view works best when read next to Gulf of Oman Map Airspace Closures Map Hormuz Strait Map, where downstream rerouting options become visible.
| Variable | Current Signal | Risk Implication | Tracking Rule |
|---|---|---|---|
| Export terminal load | Rising | Higher near-term uncertainty | Confirm over two windows |
| Queue depth | Mixed | Potentially bounded escalation | Reassess after policy updates |
| Fallback routing | Stable | De-escalation path possible | Track persistence vs narrative shift |
How Do Naval Patrol Zones Overlap Commercial Traffic?
Commercial traffic in the Gulf rarely moves in a purely civilian environment. Patrol arcs, surveillance patterns, and occasional escort operations share the same water with merchant routes, which means risk depends on timing and geometry as much as on declared policy. The more patrol zones overlap with routine tanker lanes, the more likely that a military signal will immediately affect civilian scheduling, holding behavior, and reporting discipline.
This overlap is one reason that basin-level maps outperform one-off incident reporting. A single patrol move may look minor in isolation, but if it sits across a dense route cluster or export approach it can alter commercial behavior almost immediately. Readers should connect that overlap to Al Udeid Air Base in Qatar and other basing pages when the question shifts from shipping alone to wider regional posture.
| Variable | Current Signal | Risk Implication | Tracking Rule |
|---|---|---|---|
| Patrol arcs | Rising | Higher near-term uncertainty | Confirm over two windows |
| Commercial overlap | Mixed | Potentially bounded escalation | Reassess after policy updates |
| Deconfliction timing | Stable | De-escalation path possible | Track persistence vs narrative shift |
What Does a Persian Gulf Map Reveal About Base Exposure?
A Gulf map is also a base-exposure map. Distance bands, launch corridors, and maritime support routes determine how much warning infrastructure gets before a strike and how resilient the regional posture remains after the first disruption. Bases are not only targets themselves; they are also the logistics anchors that shape escort capacity, surveillance coverage, and response tempo across the basin.
This is where geography and force posture stop being separate topics. If readers want to move from map orientation into actual vulnerability analysis, the next steps are Gulf Air Defense Interceptor Capacity and Can Iran Missiles Reach US. Those pages explain why a short distance on the map can have outsized consequences for warning time and sustained defense.
| Variable | Current Signal | Risk Implication | Tracking Rule |
|---|---|---|---|
| Base proximity | Rising | Higher near-term uncertainty | Confirm over two windows |
| Support infrastructure | Mixed | Potentially bounded escalation | Reassess after policy updates |
| Redundancy depth | Stable | De-escalation path possible | Track persistence vs narrative shift |
How Do Drone and Missile Arcs Intersect Maritime Lanes?
Missile and drone arcs matter because they turn abstract range into route-specific vulnerability. A tanker moving through a dense lane has fewer evasive options than an aircraft or warship, especially when commercial traffic, shallow-water constraints, and reporting delays reduce freedom of action. The closer a transit lane sits to likely launch areas or proxy operating space, the more a map becomes an exposure model rather than a navigation aid.
Readers should resist the temptation to treat all arcs equally. What matters is overlap with actual traffic density, not theoretical maximum range alone. That is why this section belongs in the same cluster as Iran Missile Attack Risk Index; the strike map and the shipping map only become useful when read together.
| Variable | Current Signal | Risk Implication | Tracking Rule |
|---|---|---|---|
| Arc overlap | Rising | Higher near-term uncertainty | Confirm over two windows |
| Detection lead time | Mixed | Potentially bounded escalation | Reassess after policy updates |
| Evasion options | Stable | De-escalation path possible | Track persistence vs narrative shift |
Where Are Insurance Risk Premiums Most Sensitive?
Insurance repricing often moves faster than public declarations because underwriters react to route geometry, vessel concentration, and precedent, not only to official statements. When a basin has limited substitutes and heavy export dependence, war-risk premiums can jump on the expectation of disruption rather than its confirmed duration. That makes pricing one of the clearest indicators that commercial actors think the map has changed even if governments are still using cautious language.
The most sensitive areas are usually the ones where commercial density, narrow routing, and military signaling overlap. If premiums rise around a specific lane or anchorage while traffic patterns also change, the map is showing a real stress response. That is usually a better decision signal than a dramatic headline alone.
| Variable | Current Signal | Risk Implication | Tracking Rule |
|---|---|---|---|
| Premium spikes | Rising | Higher near-term uncertainty | Confirm over two windows |
| Coverage exclusions | Mixed | Potentially bounded escalation | Reassess after policy updates |
| Claims trigger zones | Stable | De-escalation path possible | Track persistence vs narrative shift |
How Do Weather Windows Change Operational Planning?
Weather is not the main driver of Gulf risk, but it changes how quickly operators can confirm what is happening. Visibility, haze, and sea-state shifts affect observation quality, response timing, and how confidently incidents can be attributed. In a crowded basin, poor observation conditions can delay confirmation and increase the chance that routine traffic behavior is misread as strategic rerouting or vice versa.
That is why weather should be treated as a confidence modifier rather than a side note. If sea conditions and low visibility coincide with a tense update cycle, analysts should widen their uncertainty bands and wait for cross-confirmation from imagery, traffic behavior, and official advisories before claiming the corridor has fundamentally changed.
| Variable | Current Signal | Risk Implication | Tracking Rule |
|---|---|---|---|
| Visibility cycles | Rising | Higher near-term uncertainty | Confirm over two windows |
| Sea state | Mixed | Potentially bounded escalation | Reassess after policy updates |
| Observation confidence | Stable | De-escalation path possible | Track persistence vs narrative shift |
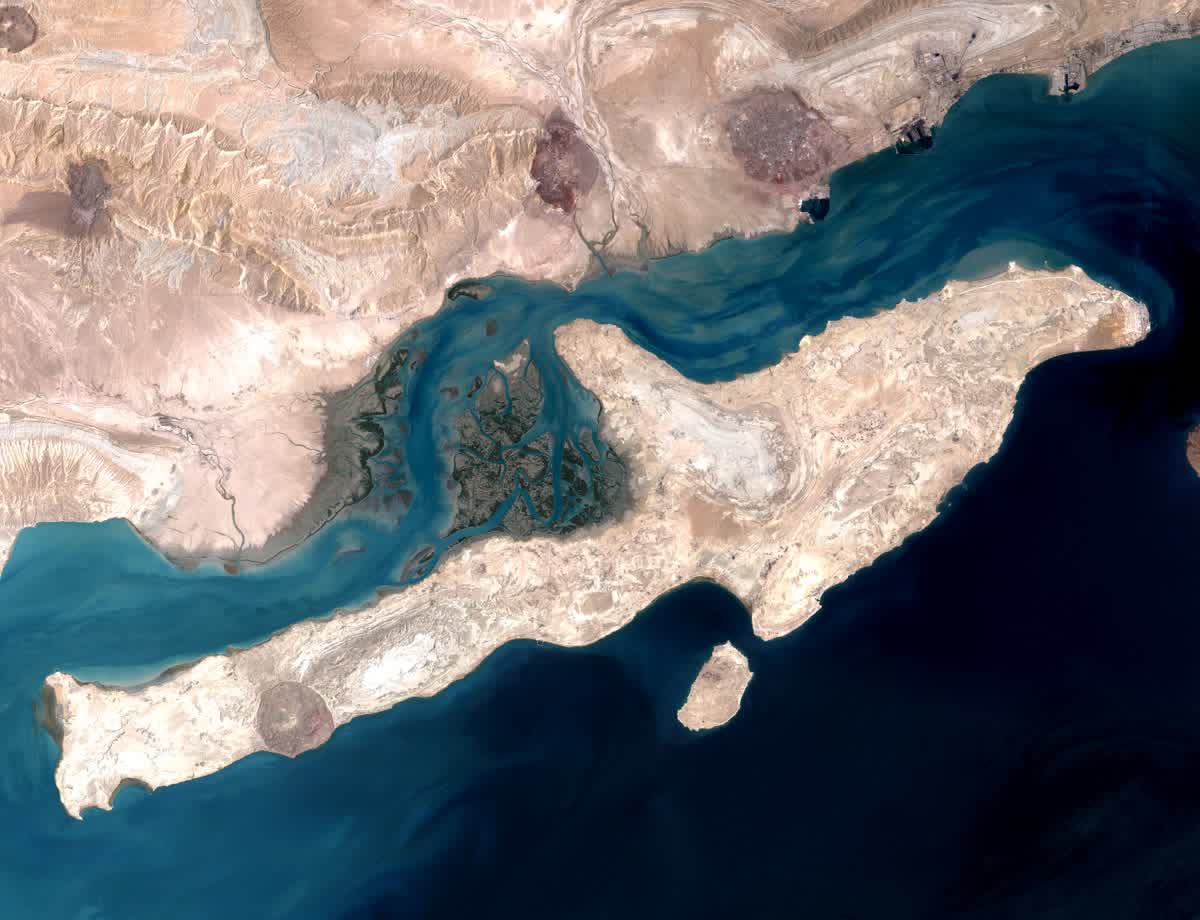
Which Satellite Indicators Matter for Daily Monitoring?
The most useful satellite-adjacent indicators are not cinematic images but repeatable signals: AIS continuity, unusual congregation near anchorages, changes in loading activity, and visible shifts around export infrastructure. These indicators matter because they show whether a route has become operationally awkward before officials describe it that way. In practical terms, they let readers see whether the basin is tightening or normalizing.
No single feed should be trusted in isolation. The strongest monitoring routine compares imagery and traffic behavior against official advisories, insurer guidance, and the site's own chronology pages. When all of those move together, the signal is stronger than any one screenshot or social-media claim.
| Variable | Current Signal | Risk Implication | Tracking Rule |
|---|---|---|---|
| AIS continuity | Rising | Higher near-term uncertainty | Confirm over two windows |
| Port throughput | Mixed | Potentially bounded escalation | Reassess after policy updates |
| Image-confirmed movement | Stable | De-escalation path possible | Track persistence vs narrative shift |
What Scenario Triggers Shift the Map from Alert to Crisis?
A basin moves from alert to crisis when several variables change together: route compression intensifies, advisories harden, military posture becomes more visible, and operators begin behaving defensively rather than opportunistically. The crisis threshold is rarely one strike clip or one speech. It is the point where multiple actors start updating behavior as if disruption will persist.
The disciplined way to read that transition is to require more than one domain of confirmation. A shipping alert, a force move, and a pricing reaction together tell a different story from any of them alone. That multi-signal approach is what keeps this page useful instead of turning it into a reactive headline mirror.
| Variable | Current Signal | Risk Implication | Tracking Rule |
|---|---|---|---|
| Trigger bundle | Rising | Higher near-term uncertainty | Confirm over two windows |
| Escalation probability | Mixed | Potentially bounded escalation | Reassess after policy updates |
| Response clock | Stable | De-escalation path possible | Track persistence vs narrative shift |
Persian Gulf Map Monitoring Checklist for 2026
A practical checklist starts with the same five questions every cycle. Has traffic density shifted? Have advisories or premiums changed? Are patrol arcs overlapping merchant lanes more aggressively? Do missile-risk pages imply less warning time? Are operators rerouting into the Gulf of Oman rather than waiting? If the answer to several of those changes at once, the map is signaling a real state change rather than background noise.
The second step is branch discipline. Use this page for basin orientation, Gulf of Oman Map Airspace Closures Map Hormuz Strait Map for downstream route spillover, and Strait of Hormuz Shipping Freeze for chokepoint-specific disruption. That reading order makes the cluster more useful for both operators and search engines.
| Variable | Current Signal | Risk Implication | Tracking Rule |
|---|---|---|---|
| Checklist cadence | Rising | Higher near-term uncertainty | Confirm over two windows |
| Threshold rules | Mixed | Potentially bounded escalation | Reassess after policy updates |
| Escalation branches | Stable | De-escalation path possible | Track persistence vs narrative shift |
FAQ: Persian Gulf Map for 2026 Conflict Monitoring
Where is the Persian Gulf on a map in relation to Iran?
It sits along Iran's southern coastline and connects to the Gulf of Oman through the Strait of Hormuz, making it central to both trade and security monitoring.
Why does Persian Gulf map detail matter for energy markets?
Because lane width, routing options, and terminal proximity directly influence tanker throughput risk, freight pricing, and oil benchmark volatility.
What should analysts track first during a sudden alert?
Track AIS continuity, insurance advisories, and naval posture changes together; single indicators often produce false positives.
How often should a Persian Gulf map risk model be updated?
In active escalation windows, update every 6 to 12 hours and trigger immediate revisions when shipping advisories or patrol patterns change materially.
How is this page different from Strait of Hormuz-only coverage?
This page covers the entire Persian Gulf operating picture and links Hormuz chokepoint effects to upstream ports, patrol arcs, and route diversification constraints.
External references: CSIS, IISS, Reuters Middle East.