Gulf of oman map monitoring matters because this corridor is where vessel traffic exits Hormuz-linked stress and enters broader Arabian Sea trade lanes. Combined with Persian Gulf map tracking, Hormuz disruption coverage, and regional base posture analysis, it gives a fuller picture of how local incidents scale into regional risk.
This page is built for operators who need route-level clarity, not generic geography. Each section maps practical decision points: lane choice, exposure windows, insurance implications, and monitoring triggers.
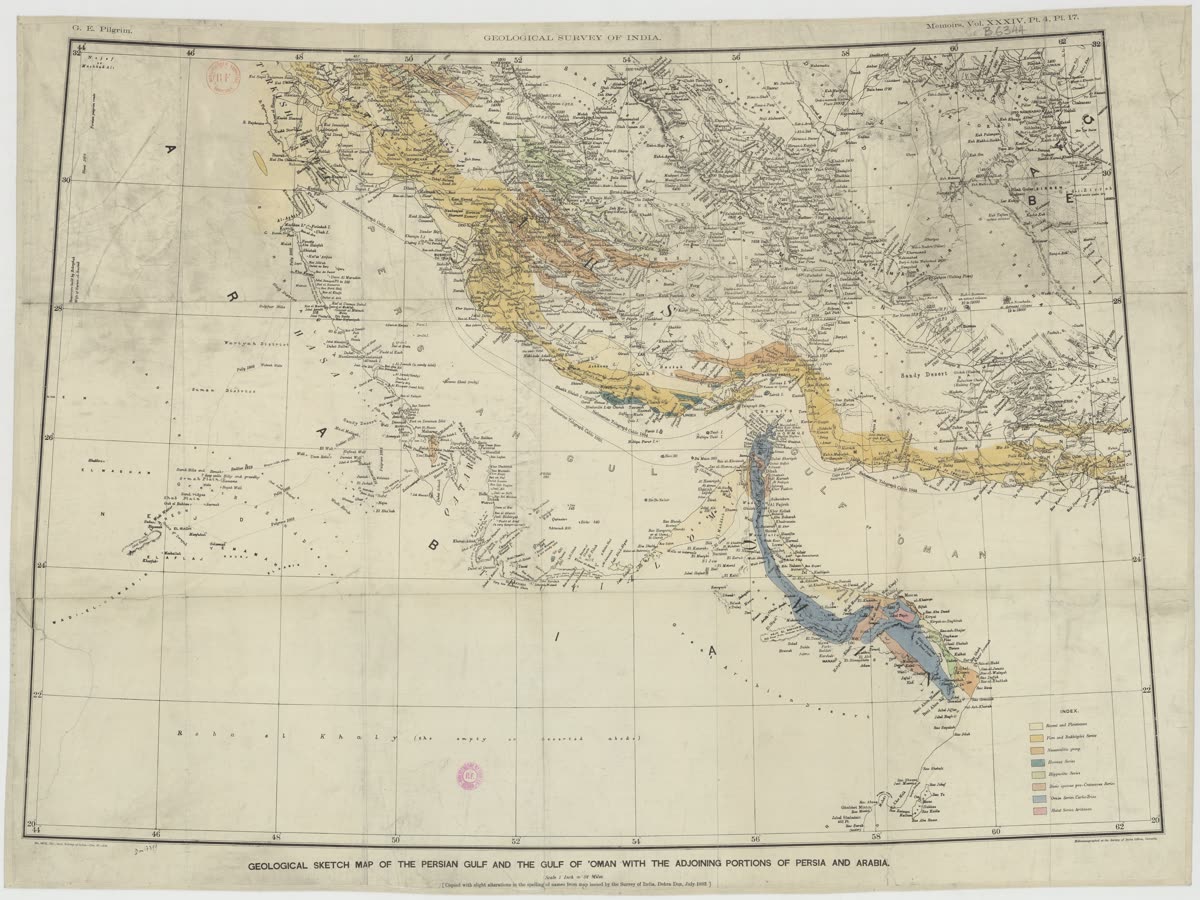
Where Is the Gulf of Oman on a Map?
The Gulf of Oman sits just beyond the Strait of Hormuz and functions as the transition zone between a tightly constrained chokepoint and the wider Arabian Sea. That positional role is the whole reason the map matters. Once traffic exits Hormuz, operators still have not left the risk environment; they have simply moved into the first basin where rerouting, waiting, and escort decisions become more visible.
Readers should think of this page as the spillover layer in the maritime cluster. Persian Gulf Map explains the basin under compression, while this page shows what happens when that compression pushes risk, traffic, and insurance decisions outward.
| Variable | Current Signal | Risk Implication | Tracking Rule |
|---|---|---|---|
| Boundary definition | Rising | Higher near-term uncertainty | Confirm over two windows |
| Transit orientation | Mixed | Potentially bounded escalation | Reassess after policy updates |
| Map context quality | Stable | De-escalation path possible | Track persistence vs narrative shift |
How Does Gulf of Oman Positioning Affect Route Choice?
Route choice in the Gulf of Oman is about managing tradeoffs rather than finding a perfectly safe path. Operators have to weigh delay costs, exposure to surveillance or interdiction, and the possibility that today's safer lane becomes tomorrow's bottleneck if too many ships make the same decision. That means route geometry changes quickly once commercial behavior becomes self-reinforcing.
The practical reading method is comparative: which paths shorten exposure, which only relocate it, and which create new congestion? If a route looks safer on paper but concentrates more vessels in one corridor, the net risk can actually rise. That is why this page works best alongside Strait of Hormuz Shipping Freeze, where the original cause of rerouting is visible.
| Variable | Current Signal | Risk Implication | Tracking Rule |
|---|---|---|---|
| Route options | Rising | Higher near-term uncertainty | Confirm over two windows |
| Transit time impact | Mixed | Potentially bounded escalation | Reassess after policy updates |
| Exposure delta | Stable | De-escalation path possible | Track persistence vs narrative shift |
What Traffic Patterns Signal Rerouting Pressure?
Rerouting pressure becomes visible before many official statements catch up. Vessel clustering, unusual waiting behavior, and repeated course adjustments often show up first in the Gulf of Oman because ships are deciding whether to continue, pause, or widen the route after leaving the narrower Hormuz approach. These patterns matter because they reflect operator risk appetite in near real time.
The key is not one abnormal track but a persistent pattern across multiple cycles. If clustering increases while advisories harden and premiums rise, the corridor is signaling real stress. That is a better early-warning system than relying on a single dramatic incident report.
| Variable | Current Signal | Risk Implication | Tracking Rule |
|---|---|---|---|
| Cluster density | Rising | Higher near-term uncertainty | Confirm over two windows |
| Holding patterns | Mixed | Potentially bounded escalation | Reassess after policy updates |
| Advisory lag | Stable | De-escalation path possible | Track persistence vs narrative shift |
How Do Naval Postures Shape Commercial Risk in This Basin?
Commercial risk in the Gulf of Oman depends heavily on how military patrols interact with merchant traffic. The basin is wider than Hormuz, but it still becomes commercially awkward when patrol geometry, surveillance, and escort requirements begin to affect timing and route confidence. In other words, a wider map does not automatically mean a looser risk environment.
This is where commercial and military pictures must be read together. Pages like Al Udeid Air Base in Qatar help explain why patrol intensity or logistics strain can change merchant behavior even when no formal closure exists. A corridor under escort pressure is often a corridor already being treated as unstable.
| Variable | Current Signal | Risk Implication | Tracking Rule |
|---|---|---|---|
| Patrol overlap | Rising | Higher near-term uncertainty | Confirm over two windows |
| Escort bandwidth | Mixed | Potentially bounded escalation | Reassess after policy updates |
| Commercial friction | Stable | De-escalation path possible | Track persistence vs narrative shift |
Which Port Approaches Are Most Sensitive to Escalation?
The most sensitive approaches are the ones where terminal access, tanker timing, and corridor geometry all converge. A disruption near a port approach can have an outsized effect because it delays not only the ship directly involved but also every following vessel waiting for clearer routing or revised guidance. That is why approach routes deserve their own analysis rather than being folded into generic basin commentary.
Analysts should ask which approaches are hard to substitute and which can absorb traffic loss more gracefully. If a terminal depends on a narrow route segment, even a short-lived incident can have longer commercial consequences than its headline suggests.
| Variable | Current Signal | Risk Implication | Tracking Rule |
|---|---|---|---|
| Approach concentration | Rising | Higher near-term uncertainty | Confirm over two windows |
| Diversion options | Mixed | Potentially bounded escalation | Reassess after policy updates |
| Throughput sensitivity | Stable | De-escalation path possible | Track persistence vs narrative shift |
How Do Insurance and Charter Rates React to Gulf of Oman Signals?
Insurance and charter markets watch the Gulf of Oman closely because it is where local security stress starts to become a broader freight problem. Underwriters and charterers do not wait for a full basin closure before repricing. They respond to route uncertainty, waiting behavior, escort complexity, and the possibility that one localized shock could widen into a regional detour pattern.
That makes pricing behavior a useful confirmation layer. If premiums and charter terms start to shift in the Gulf of Oman while the upstream basin still looks only partially disrupted, the market is telling you the corridor is already being treated as fragile.
| Variable | Current Signal | Risk Implication | Tracking Rule |
|---|---|---|---|
| Premium trend | Rising | Higher near-term uncertainty | Confirm over two windows |
| Coverage constraints | Mixed | Potentially bounded escalation | Reassess after policy updates |
| Repricing lag | Stable | De-escalation path possible | Track persistence vs narrative shift |
What Role Does the Arabian Sea Interface Play?
The Arabian Sea interface is the point where a Gulf-specific security story becomes a regional commercial story. Once vessels move beyond the immediate chokepoint, the question shifts from 'can they get through?' to 'what route structure, timing, and insurance conditions now define the wider voyage?' That is why the Gulf of Oman is the connective tissue between a local military alert and a global freight reaction.
The interface also matters because it changes who has to care. Traders, charterers, and ports farther from the original incident begin adjusting behavior once the spillover reaches this basin. That propagation dynamic is one reason this page adds value beyond a simple location explainer.
| Variable | Current Signal | Risk Implication | Tracking Rule |
|---|---|---|---|
| Interface crossings | Rising | Higher near-term uncertainty | Confirm over two windows |
| Spillover indicators | Mixed | Potentially bounded escalation | Reassess after policy updates |
| Regional propagation | Stable | De-escalation path possible | Track persistence vs narrative shift |
How Should Analysts Track Overnight Changes?
Overnight changes are often where corridor interpretation breaks down because observation is thinner, reporting lags widen, and operators make conservative route decisions before public explanations appear. A good overnight workflow compares movement patterns, official advisories, and visible military posture across the same time window rather than trying to infer too much from one data source alone.
The goal is to reduce false positives. If a route shift appears overnight but is not confirmed by advisories, premiums, or repeated traffic behavior, the right move is usually to mark the change as provisional. Confidence should rise only when multiple signals persist into the next update window.
| Variable | Current Signal | Risk Implication | Tracking Rule |
|---|---|---|---|
| Night delta | Rising | Higher near-term uncertainty | Confirm over two windows |
| Signal validation | Mixed | Potentially bounded escalation | Reassess after policy updates |
| Confidence scoring | Stable | De-escalation path possible | Track persistence vs narrative shift |
What Does a Gulf of Oman Map Reveal About Base Logistics?
A Gulf of Oman map is not only about merchant traffic. It also reveals how maritime instability can affect regional logistics nodes, resupply timing, and base support networks. The closer a logistics corridor sits to a stressed sea lane, the more likely it is that military and commercial friction will compound rather than remain separate problems.
This matters because a corridor under repeated disruption forces hard choices about escort allocation, sortie support, and endurance. The map becomes more useful when it is read with infrastructure and resilience pages rather than as a purely civilian route guide.
| Variable | Current Signal | Risk Implication | Tracking Rule |
|---|---|---|---|
| Logistics nodes | Rising | Higher near-term uncertainty | Confirm over two windows |
| Sea-lane dependency | Mixed | Potentially bounded escalation | Reassess after policy updates |
| Resilience margin | Stable | De-escalation path possible | Track persistence vs narrative shift |
Which Monitoring Triggers Should Escalate Alert Levels?
Alert levels should change only when multiple corridor signals move together. A lone advisory or one unusual route cluster may justify attention, but not necessarily a status shift. The stronger trigger bundle is repeated clustering, harder pricing, visible patrol overlap, and confirmation that operators are making enduring route changes rather than short-term pauses.
That threshold discipline is what makes a map operationally useful. Without it, analysts end up reacting to noise. With it, the page becomes a practical bridge between geography and decision quality.
| Variable | Current Signal | Risk Implication | Tracking Rule |
|---|---|---|---|
| Trigger bundles | Rising | Higher near-term uncertainty | Confirm over two windows |
| Alert thresholds | Mixed | Potentially bounded escalation | Reassess after policy updates |
| Escalation branch | Stable | De-escalation path possible | Track persistence vs narrative shift |
Where Is the Gulf of Oman on a Map Relative to Hormuz Risk?
Relative to Hormuz, the Gulf of Oman is close enough that shock effects arrive quickly but wide enough that operators still have meaningful route choices. That combination is what makes it such a sensitive indicator basin. It is the first place where a chokepoint event becomes a wider corridor-management problem.
The practical implication is response timing. If planning waits until disruptions are visible in the Arabian Sea, it is already late. The Gulf of Oman is where the propagation should be noticed and measured first.
| Variable | Current Signal | Risk Implication | Tracking Rule |
|---|---|---|---|
| Distance bands | Rising | Higher near-term uncertainty | Confirm over two windows |
| Propagation timing | Mixed | Potentially bounded escalation | Reassess after policy updates |
| Response windows | Stable | De-escalation path possible | Track persistence vs narrative shift |
Gulf of Oman Map Checklist for 2026 Operations
A useful checklist starts with the same core questions. Are routes bunching? Are advisories harder? Have premiums moved? Are patrol arcs affecting merchant timing? Is spillover reaching the Arabian Sea interface? Those questions force the analyst to track corridor quality rather than simply retelling the last incident.
For full cluster coverage, use Persian Gulf Map to understand basin concentration, this page to measure spillover and rerouting, and Strait of Hormuz Shipping Freeze when the chokepoint itself becomes the dominant story.
| Variable | Current Signal | Risk Implication | Tracking Rule |
|---|---|---|---|
| Checklist cadence | Rising | Higher near-term uncertainty | Confirm over two windows |
| Control rules | Mixed | Potentially bounded escalation | Reassess after policy updates |
| Update triggers | Stable | De-escalation path possible | Track persistence vs narrative shift |
FAQ: Gulf of Oman Map for Maritime Corridor Assessment
Where is the Gulf of Oman on a map relative to the Strait of Hormuz?
It lies southeast of the Strait of Hormuz and serves as the first wider basin vessels enter after leaving the narrow Hormuz transit corridor.
Why does Gulf of Oman routing matter during escalation?
Because rerouting, waiting patterns, and insurance repricing often appear there before disruption impacts are fully visible in global energy benchmarks.
What is the most useful early warning signal in this corridor?
Persistent vessel clustering combined with advisory changes and patrol adjustments is usually more reliable than any single incident report.
How frequently should this map be updated in high-tempo periods?
Every 6 to 12 hours, with immediate updates when commercial advisories or military posture shifts alter route viability.
How is this different from a general Arabian Sea map?
This page is corridor-specific and focuses on how Hormuz-linked shocks propagate through the Gulf of Oman into broader maritime and market systems.
External references: CSIS, IISS, Reuters Middle East.