Strait of hormuz map analysis should start with one practical point: this corridor is where a large share of Gulf energy exports converges into tightly managed shipping lanes before entering open-sea routes. If you already follow the Persian Gulf map, Gulf of Oman map, and Strait of Hormuz war risk insurance guide, this page adds the geography layer that explains why small location shifts can trigger disproportionate market reactions.
This is not a generic atlas entry. It is an operations-oriented map brief built for analysts, journalists, and decision teams who need to separate structural chokepoint risk from headline noise. Throughout the guide, route logic is tied to measurable variables: lane compression, transit tempo, insurance repricing, and spillover into downstream freight networks.
Where is the Strait of Hormuz on a map?
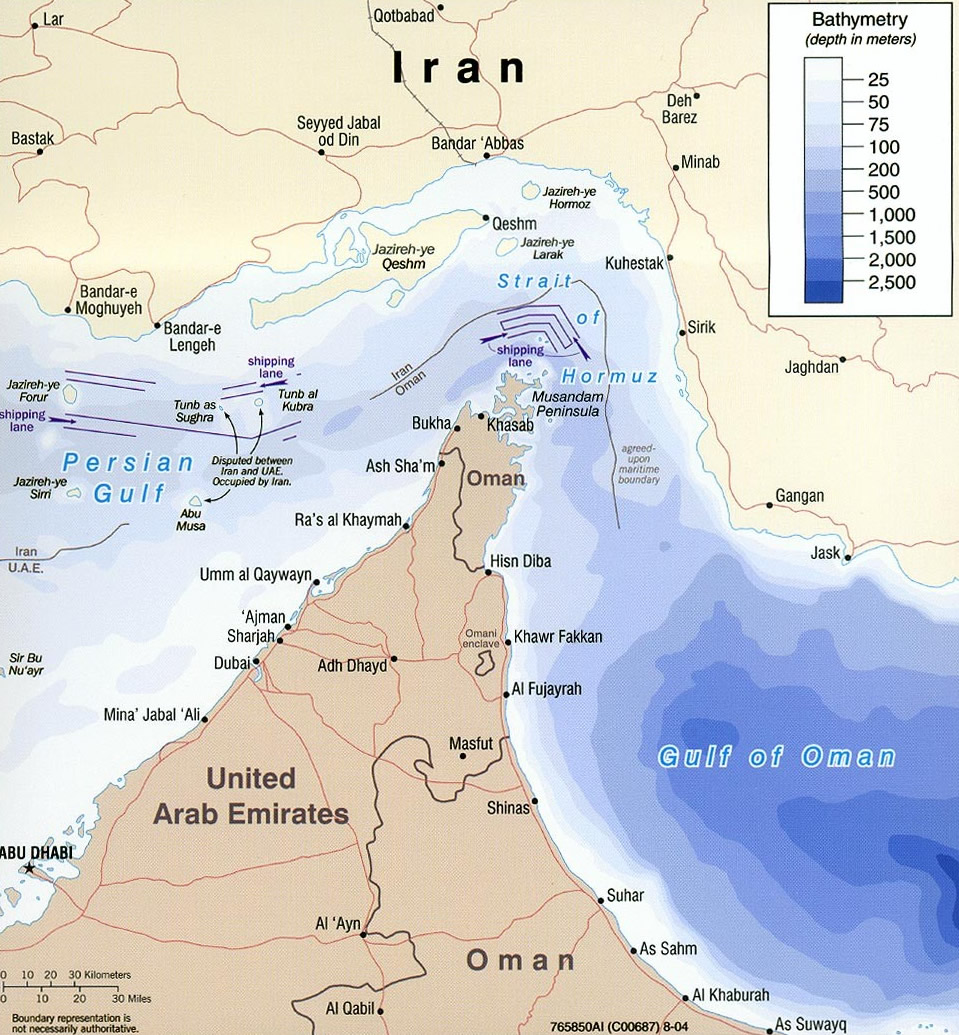
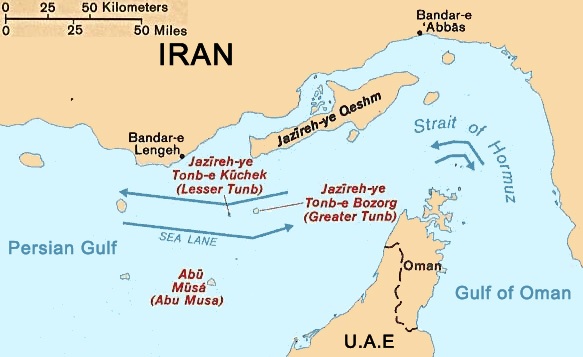
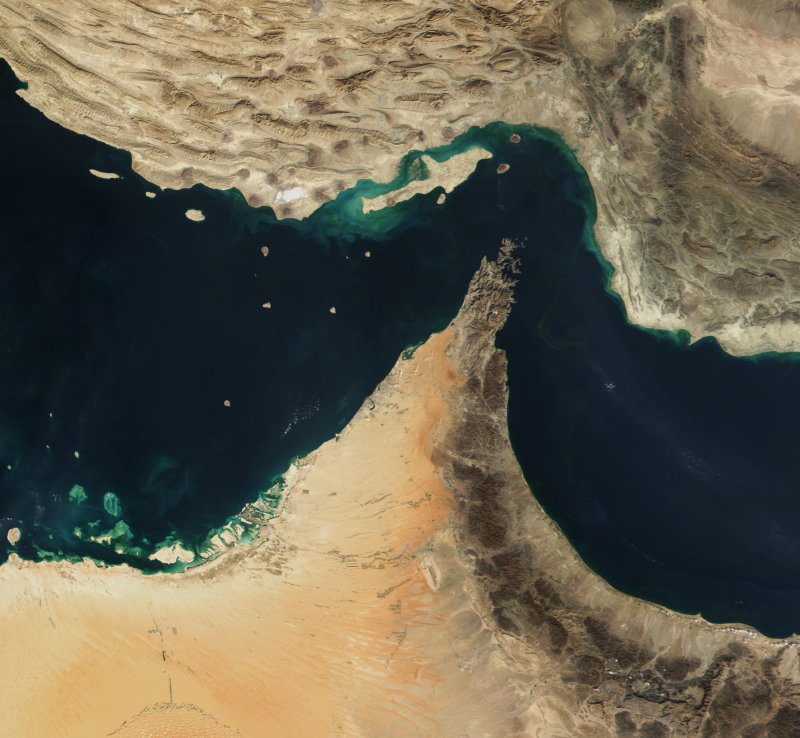
The Strait of Hormuz sits between Iran to the north and Oman’s Musandam Peninsula to the south, connecting the Persian Gulf to the Gulf of Oman and then the Arabian Sea. On a strategic map, it is the narrow exit funnel for Gulf terminals in Saudi Arabia, Iraq, Kuwait, Bahrain, Qatar, and the UAE. That geographic role explains why location awareness is not optional. If your map interpretation is off by even one segment, your estimate of vessel exposure and transit alternatives will be wrong.
Why location precision matters
Many readers know the strait by name but misplace the operational boundaries. The useful boundary is not only the visual waterway; it is the traffic-managed corridor where inbound and outbound lanes, buffers, and patrol patterns interact. In high-tempo periods, that managed geometry decides whether traffic remains orderly or starts to queue. Queueing is often the first observable sign of broader disruption risk, before authorities use closure language.
Map signal ruleIf lane behavior changes faster than public statements, trust the map and verify policy updates in parallel.
Why is the Strait of Hormuz important for energy markets?
The strait is treated as a global chokepoint because it combines high-volume throughput with limited immediate substitutes. U.S. Energy Information Administration tracking repeatedly classifies it among the top oil-transit chokepoints globally, and LNG trade from Qatar further amplifies significance. Markets therefore react to perceived risk in this corridor even before confirmed physical outages appear. Pricing moves are driven by expected constraint probability, not only observed lost barrels.
From corridor stress to price response
When incident frequency rises near Hormuz, trading desks usually evaluate three questions: will traffic slow, will insurance tighten, and will escort demand rise? Even a partial yes to those questions can widen futures spreads and freight premiums. That means a map update can become a pricing input within hours. For context on recent disruption narratives, readers should pair this page with Strait of Hormuz shipping freeze coverage, which tracks event tempo while this article tracks route mechanics.
| Variable | Current Signal | Risk Implication | Tracking Rule |
|---|---|---|---|
| Transit concentration | High | Price sensitivity rises quickly | Watch EIA chokepoint updates |
| LNG dependence | Elevated | Gas market spillover risk | Track export nomination changes |
| Escort demand | Variable | Potential throughput friction | Compare against incident tempo |
How wide is the strait and why do lanes matter more than total width?
Readers frequently search “how wide is the strait of hormuz,” but the headline width is less operationally important than navigable lane structure. Shipping relies on designated inbound and outbound traffic lanes separated by a buffer zone under international navigation practice. In other words, usable transit space for safe, high-volume flow is narrower than a casual map glance suggests.
Lane logic under stress
During normal periods, lane discipline preserves speed and predictability. During crisis periods, lane discipline competes with evasive routing, inspection risk, and convoy behavior. If too many vessels alter path at once, congestion can appear even without formal closure. That is why analysts should model lane utilization and transit behavior, not just the geographic silhouette of the strait.
Which shipping routes are most exposed inside the corridor?
The most exposed routes are those with least path flexibility at high traffic density: terminal approaches feeding directly into outbound lanes, crossing points where merchant and security traffic overlap, and segments where waiting areas are limited. Exposure is not evenly distributed. Two vessels may both be “in Hormuz,” but one may still have maneuver options while another is effectively committed to a constrained track segment.
Practical exposure scoring
A working exposure score should combine route commitment, local congestion, and likely delay penalties. For example, a tanker close to open-sea exit with low queue pressure has lower short-term vulnerability than a vessel entering from the Gulf during an advisory hardening cycle. This approach prevents overreaction to single incidents and keeps decisions tied to route state instead of social-media intensity.
| Segment Type | Observed Pattern | Risk Effect | Monitoring Trigger |
|---|---|---|---|
| Inbound approach | Speed compression | Queue formation risk | Repeated AIS slowing |
| Narrow-lane transit | High density | Delay and incident amplification | Course-correction spikes |
| Exit transition | Dispersal phase | Lower congestion, residual exposure | Escort handoff changes |
How much oil and LNG transits the Strait of Hormuz?
Exact monthly totals vary, but mainstream public datasets consistently place Hormuz at the center of global petroleum and LNG movement. EIA’s chokepoint reporting often frames flows at roughly one-fifth of global petroleum liquids consumption for recent years, while LNG flows remain heavily influenced by Qatari exports. For analysts, the key is not memorizing one static number; it is maintaining a current range and updating assumptions when production, sanctions, or export infrastructure changes.
Avoid static-number errors
Static headline numbers age quickly. A better method is to treat flow shares as scenario bands: baseline, constrained, and disrupted. Then evaluate how each band changes freight cost, refinery feedstock choices, and substitute-route feasibility. This makes the map operational for planning because every location point links to a downstream commercial effect.
Authoritative references for this section: U.S. EIA world oil transit chokepoints and International Energy Agency market reporting.
What happens if the Strait of Hormuz closes?
A full closure is rare and politically costly, but even temporary or partial disruptions can trigger immediate market and logistics effects. The first phase is informational: advisories, reroute announcements, and insurance communication. The second phase is operational: slower transits, queueing, and changed convoy patterns. The third phase is financial: freight and energy repricing based on expected duration and probability of recurrence.
Closure scenarios are not binary
Most risk episodes are partial and dynamic rather than absolute. Analysts should model at least three closure states: lane friction, restricted passage, and full interruption. Each state has different impacts on transit time, charter pricing, and policy response. This framework reduces the common mistake of jumping from “no closure” directly to “global shutdown.”
Scenario baselineSmall route frictions can move prices before any confirmed sustained physical outage appears.
How do insurance and charter rates react to Hormuz risk?
Insurance and charter markets are usually the fastest translators of route risk into commercial cost. War-risk premiums can rise within hours when underwriters perceive elevated uncertainty in transit lanes, and charterers may add buffer time or route contingencies to contract terms. Those adjustments matter because they influence ship availability and delivery certainty, even if physical transit continues.
What to watch in live pricing behavior
Three signals are especially useful: sudden premium jumps, shorter quote validity windows, and expanded exclusion language in voyage terms. Together they indicate that counterparties are pricing unpredictability rather than one event. For a detailed cost lens, use this page with our war risk insurance explainer, which breaks down pricing mechanics and trigger logic.
Operational advisories worth monitoring include the UKMTO maritime security updates and IMO guidance and notices.
What signals should you monitor on a Strait of Hormuz map?
A decision-grade map workflow should blend geographic and behavioral indicators. Geographic indicators include lane density, bottleneck hotspots, and approach-route concentration. Behavioral indicators include repeated slowing, holding patterns, and path divergence from historical norms. Market indicators include insurance repricing and freight quote shifts. Policy indicators include advisories and naval posture statements.
A repeatable monitoring cadence
In stable periods, two updates per day may be enough. During rapid escalation, a six-hour cadence is more useful. Each update should capture deltas, not just snapshots: what changed since last cycle, what signals converged, and what remains unconfirmed. This approach creates consistency and helps teams avoid oscillating between panic and complacency.
| Signal Family | Example Indicator | Why It Matters | Alert Threshold |
|---|---|---|---|
| Route geometry | Lane crowding | Early congestion marker | Persistent over two windows |
| Vessel behavior | Holding patterns | Transit confidence drop | Cross-source confirmation |
| Commercial terms | War-risk jump | Market stress signal | Same-day repricing cycle |
How does Hormuz link to nearby map pages?
The Strait of Hormuz map is most useful when read as the middle layer of a three-map cluster. The Persian Gulf map explains upstream concentration and terminal geography. This page explains chokepoint transit itself. The Gulf of Oman map explains downstream spillover, rerouting, and interface risk with open-sea lanes. Readers who only use one page often miss propagation speed between zones.
Building a stronger internal map graph
For users and crawlers, this three-page sequence clarifies topic differentiation and reduces content overlap. It also improves decision quality: upstream, chokepoint, and downstream signals each get their own analytical frame. Add in live updates from the timeline archive when the question is sequence rather than geometry.

How should teams use a Strait of Hormuz map in daily operations?
A useful strait of hormuz map workflow is less about one dramatic screenshot and more about disciplined update cycles. Risk teams should treat this page as a decision sheet that supports daily tradeoffs: continue transit, adjust timing, reroute, or add contractual protection. The strongest process begins with a fixed template that captures lane state, vessel behavior, advisory posture, and commercial response in one place.
A practical morning-to-evening workflow
In a morning briefing, teams can mark baseline route conditions, including whether inbound and outbound lanes are flowing at expected pace. By midday, they should compare observed movement against baseline and log any signs of clustering or repeated holding patterns. Evening updates should then evaluate whether changes were temporary noise or persistent pressure. This three-pass method prevents analysts from locking decisions to single headlines and improves consistency across shifts.
The map becomes more valuable when operational and commercial teams share the same thresholds. For example, operations may trigger caution when vessel behavior diverges, while chartering may trigger cost controls when premiums rise beyond predefined bands. When both teams work from one map and one threshold table, decisions become faster and less contradictory.
Integrating map signals with governance
Organizations that move energy, industrial feedstock, or strategic cargo should also connect map triggers to governance rules. That includes who can authorize reroutes, when to escalate to executive review, and how to document assumptions for post-incident analysis. Good governance does not slow reaction; it removes ambiguity when timing matters most.
This governance layer is also where internal links matter. A manager reading this page can jump to the insurance page for pricing implications, the timeline archive for sequence context, and the US-Iran relations explainer for diplomatic constraints that may widen or narrow risk windows.
| Update Window | Primary Check | Decision Output | Escalation Trigger |
|---|---|---|---|
| Morning baseline | Lane flow and advisory status | Normal, caution, or elevated watch | Divergence from prior day baseline |
| Midday delta | Holding patterns and reroute behavior | Transit timing adjustment | Persistent clustering across cycles |
| End-of-day review | Insurance and charter repricing | Contract and route policy change | Multi-signal confirmation of sustained stress |
FAQ: Strait of Hormuz map
Where is the Strait of Hormuz on a map?
It lies between Iran and Oman at the outlet of the Persian Gulf into the Gulf of Oman. On operational charts, focus on lane geometry rather than coastline alone.
Why is the Strait of Hormuz important?
It is a high-volume energy chokepoint where disruptions can move oil, LNG, freight, and insurance pricing rapidly. Even partial transit friction can have global commercial effects.
How wide is the Strait of Hormuz for practical shipping?
Practical shipping space is defined by traffic separation lanes and safety buffers, not full geographic width. That is why lane behavior is a better risk indicator than map width alone.
What percentage of oil passes through the strait?
Public-source estimates commonly place Hormuz around one-fifth of global petroleum liquids consumption in recent years, but exact figures vary by period. Use current EIA data for updated baselines.
What happens if the Strait of Hormuz closes?
Expect immediate reroute pressure, higher insurance costs, and energy-price volatility while markets price duration risk. Impacts usually begin with expectations before full physical shortages appear.
External references: U.S. EIA chokepoint analysis, UKMTO advisories, Reuters Middle East.